SEVIRI Level 1.5#
Wildfires Exploration Standard Python
![]()
![]()
![]()
![]()
![]()
Context#
Purpose#
Explore SEVIRI satellite imagery and wildfire data that is open and free for scientific use.
Sensor description#
The SEVIRI Level 1.5 Image Data product contains provides 12 spectral channels. Level 1.5 image data corresponds to the geolocated and radiometrically pre-processed image data, ready for further processing, e.g. the extraction of meteorological products.
Highlights#
Use
satpyto load, visualise, and regrid SEVIRI level 1.5 data.Fetch a fire database containing some 8080 fires from September 1st, 2020.
Visualisation of fire pixels from the database.
Visualisation of the fire pixels alongside bands from the SEVIRI satellite data.
Demonstration of how to write a custom
intakedriver forsatpy.
Contributions#
Notebook#
Samuel Jackson (author), Science & Technology Facilities Council, @samueljackson92
Alejandro Coca-Castro (reviewer), The Alan Turing Institute, @acocac
Dataset originator/creator#
SEVIRI Level 1.5 Image Data - MSG - 0 degree#
European Organisation for the Exploitation of Meteorological Satellites (EUMETSAT)
FRPPIXEL#
Land Surface Analysis, Satellite Application Facility on Land Surface Analysis (LSA SAF)
Dataset documentation#
Martin Wooster, Jiangping He, Weidong Xu, and Alessio Lattanzio. Frp - product user manual. URL: https://nextcloud.lsasvcs.ipma.pt/s/pnDEepeq8zqRyrq (visited on 2021-11-18).
MJ Wooster, G Roberts, PH Freeborn, W Xu, Y Govaerts, R Beeby, J He, A Lattanzio, D Fisher, and R Mullen. Lsa saf meteosat frp products–part 1: algorithms, product contents, and analysis. Atmospheric Chemistry and Physics, 15(22):13217–13239, 2015.
Note
The author acknowledges EUMETSAT.
Install and load libraries#
Show code cell source
!pip -q install pyspectral
!pip -q install 'satpy==0.26.0'
!pip -q install pyorbital
!pip -q install geopandas
!pip -q install geoviews
WARNING: The directory '/home/jovyan/.cache/pip' or its parent directory is not owned or is not writable by the current user. The cache has been disabled. Check the permissions and owner of that directory. If executing pip with sudo, you should use sudo's -H flag.
WARNING: Running pip as the 'root' user can result in broken permissions and conflicting behaviour with the system package manager. It is recommended to use a virtual environment instead: https://pip.pypa.io/warnings/venv
Show code cell source
import pandas as pd
import numpy as np
import geopandas
import intake
import fsspec, aiohttp
import hvplot.xarray
import hvplot.pandas
import holoviews as hv
import panel as pn
import satpy
import xarray as xr
import tempfile
from scipy.spatial import cKDTree
from satpy.writers import get_enhanced_image
from getpass import getpass
from pathlib import Path
from pyresample import geometry
from pyresample import create_area_def
import datetime
import urllib.request
import os.path
import requests
from pathlib import Path
from dotenv import load_dotenv
import warnings
warnings.filterwarnings(action='ignore')
Set project structure#
notebook_folder = Path('./notebook')
if not notebook_folder.exists():
    notebook_folder.mkdir(exist_ok=True)
Fetch Data#
Note
To download data from the EUMETSAT’s Data site you must have a valid account. Please register with EUMETSAT’s data sevices if you do not already have an account. Then provide your consumer key and consumer secret when prompted in the cell below. Your consumer key and consumer secret can be found at the following url: https://api.eumetsat.int/api-key/
Now you should successfully be able to download SEVIRI data.
file_path = notebook_folder / 'MSG4-SEVI-MSG15-0100-NA-20200901104243.230000000Z-NA.nat'

if not file_path.is_file() or file_path.stat().st_size  == 0:
    load_dotenv()
    consumer_key = os.environ.get("EUMESAT_API_KEY") #replace for your EUMESAT consumer key if run local or in Binder
    consumer_secret = os.environ.get("EUMESAT_API_SECRET") #replace for your EUMESAT consumer secret if run local or in Binder

    token_url = 'https://api.eumetsat.int/token'
    response = requests.post(
            token_url,
            auth=requests.auth.HTTPBasicAuth(consumer_key, consumer_secret),
            data = {'grant_type': 'client_credentials'},
            headers = {"Content-Type" : "application/x-www-form-urlencoded"}
        )

    access_token = response.json()['access_token']

    filename = 'MSG4-SEVI-MSG15-0100-NA-20200901104243.230000000Z-NA.nat'

    product_url = 'https://api.eumetsat.int/data/download/collections/EO%3AEUM%3ADAT%3AMSG%3AHRSEVIRI/products/MSG4-SEVI-MSG15-0100-NA-20200901104243.230000000Z-NA/entry'
    product_url += f'?name={filename}'
    product_url += f'&access_token={access_token}'

    urllib.request.urlretrieve(product_url, str(file_path))
Download the fire pixel data for this day from Zenodo. This data is not directly downloadable from the internet, so we share a subset of fires for this imagery here.
filename = 'HDF5_LSASAF_MSG_FRP-PIXEL-ListProduct_MSG-Disk_202009011045'
file_path = notebook_folder / filename
url = f'https://zenodo.org/record/5717106/files/{filename}?download=1'

if not file_path.is_file() or file_path.stat().st_size  == 0:
    urllib.request.urlretrieve(url, file_path)
Load an intake catalog for the downloaded data
catalog_file = notebook_folder / 'catalog.yaml'

with catalog_file.open('w') as f:
    f.write('''
sources:
    seviri_l1b:
      args:
        urlpath: 'notebook/MSG4-SEVI-MSG15-0100-NA-20200901104243.230000000Z-NA.nat'
        reader: 'seviri_l1b_native'
      description: "SEVIRI Level 1.5 Products"
      driver: SatpySource
      metadata: {}
    seviri_fires:
      args:
        urlpath: 'notebook/HDF5_LSASAF_MSG_FRP-PIXEL-ListProduct_MSG-Disk_202009011045'
      description: "SEVIRI Level 2 Fires"
      driver: netcdf
      metadata: {}
''')
from intake.source.base import PatternMixin
from intake.source.base import DataSource, Schema

import glob

class SatpySource(DataSource, PatternMixin):
    """Intake driver for data supported by satpy.Scene"""

    container = 'python'
    name = 'satpy'
    version = '0.0.1'
    partition_access = False

    def __init__(self, urlpath, reader=None, metadata=None, path_as_pattern=True):
        """
        Parameters
        ----------
        path: str, location of model pkl file
        Either the absolute or relative path to the file
        opened. Some examples:
          - ``{{ CATALOG_DIR }}/file.nat``
          - ``{{ CATALOG_DIR }}/*.nc``
        reader: str, optional
        Name of the satpy reader to use when loading data (ie. ``modis_l1b``)
        metadata: dict, optional
        Additional metadata to pass to the intake catalog
        path_as_pattern: bool or str, optional
        Whether to treat the path as a pattern (ie. ``data_{field}.nc``)
        and create new coodinates in the output corresponding to pattern
        fields. If str, is treated as pattern to match on. Default is True.
        """

        self.path_as_pattern = path_as_pattern
        self.urlpath = urlpath
        self._reader = reader
        super(SatpySource, self).__init__(metadata=metadata)

    def _load(self):
        files = self.urlpath
        files = list(glob.glob(files))
        return satpy.Scene(files, reader=self._reader)

    def _get_schema(self):
        self._schema = Schema(
            npartitions=1,
            extra_metadata={}
        )
        return self._schema

    def read(self):
        self._load_metadata()
        return self._load()

intake.register_driver('SatpySource', SatpySource)
cat = intake.open_catalog(catalog_file)
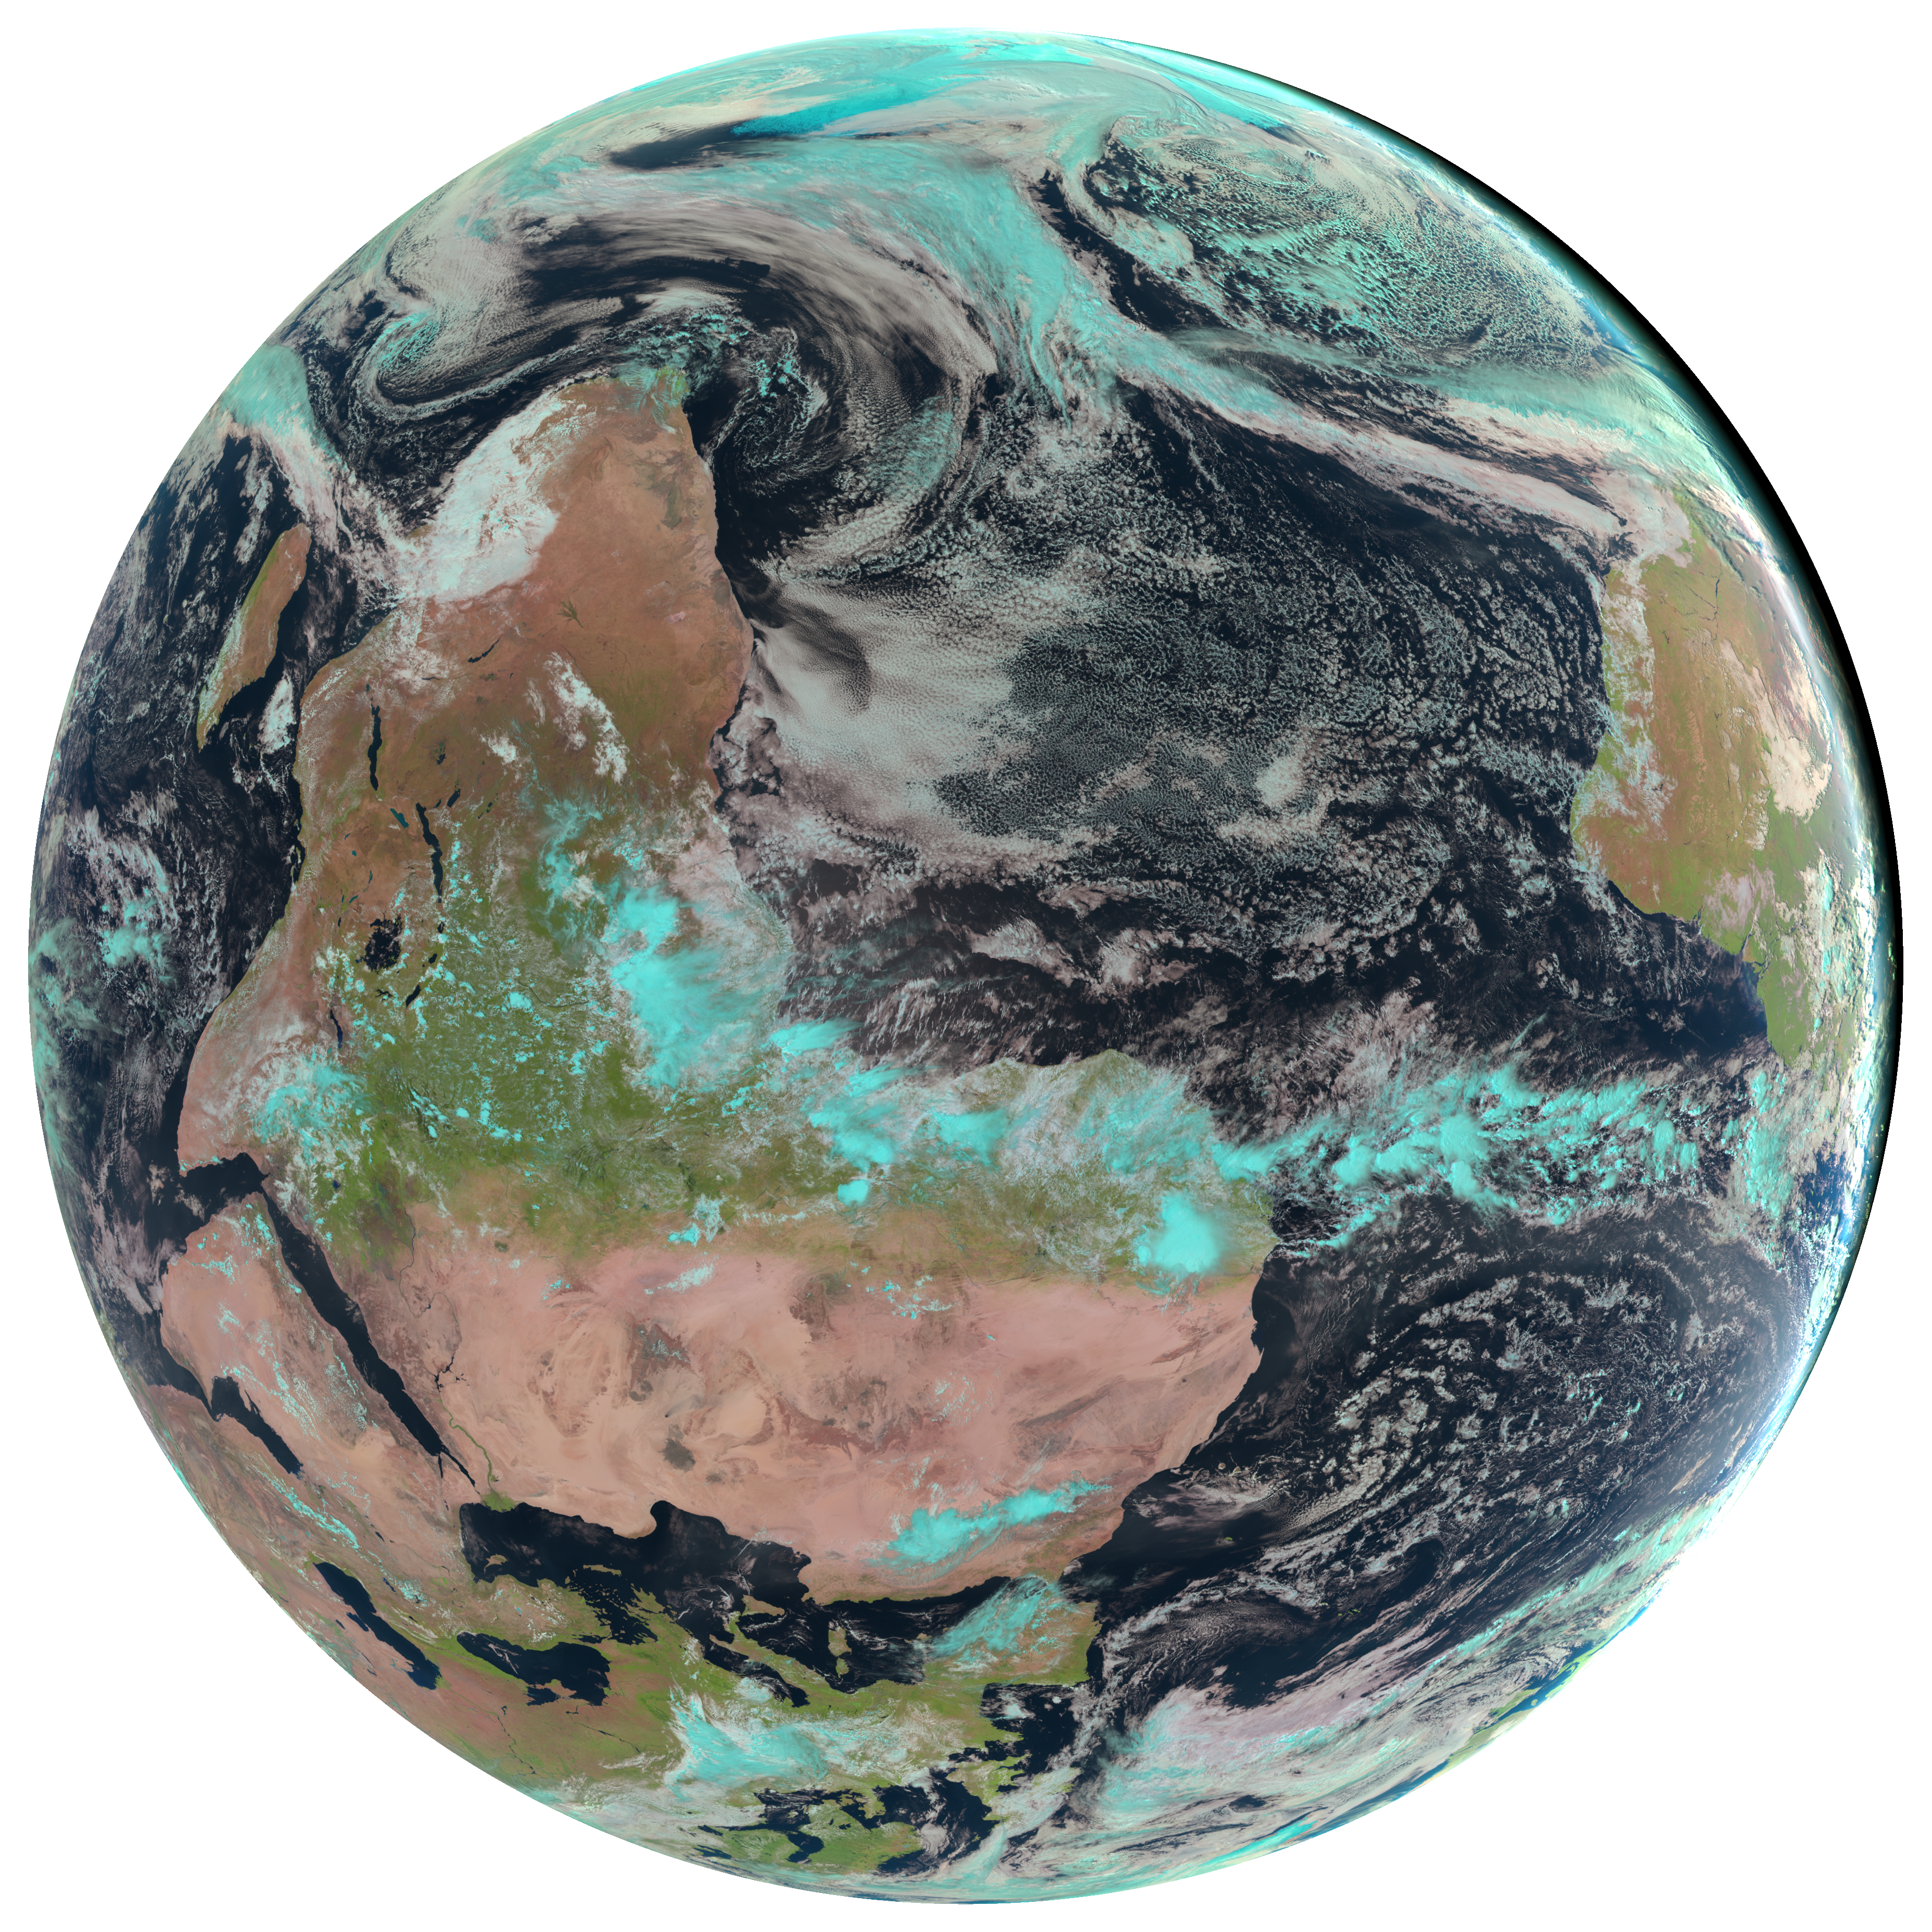
Load SEVIRI Satellite Data#
Here we use satpy to load the SEVIRI level 1b data into memory. As well as loading the image data, satpy provides a easy way to regrid the data to different coordinate systems.
scn = cat['seviri_l1b'].read()
scn
<satpy.scene.Scene at 0x7f2ffae6d850>
Show code cell source
scn.load(['natural_color', 'IR_039', 'IR_108'])
plot_seviri_raw = scn.show('natural_color')
plot_seviri_raw
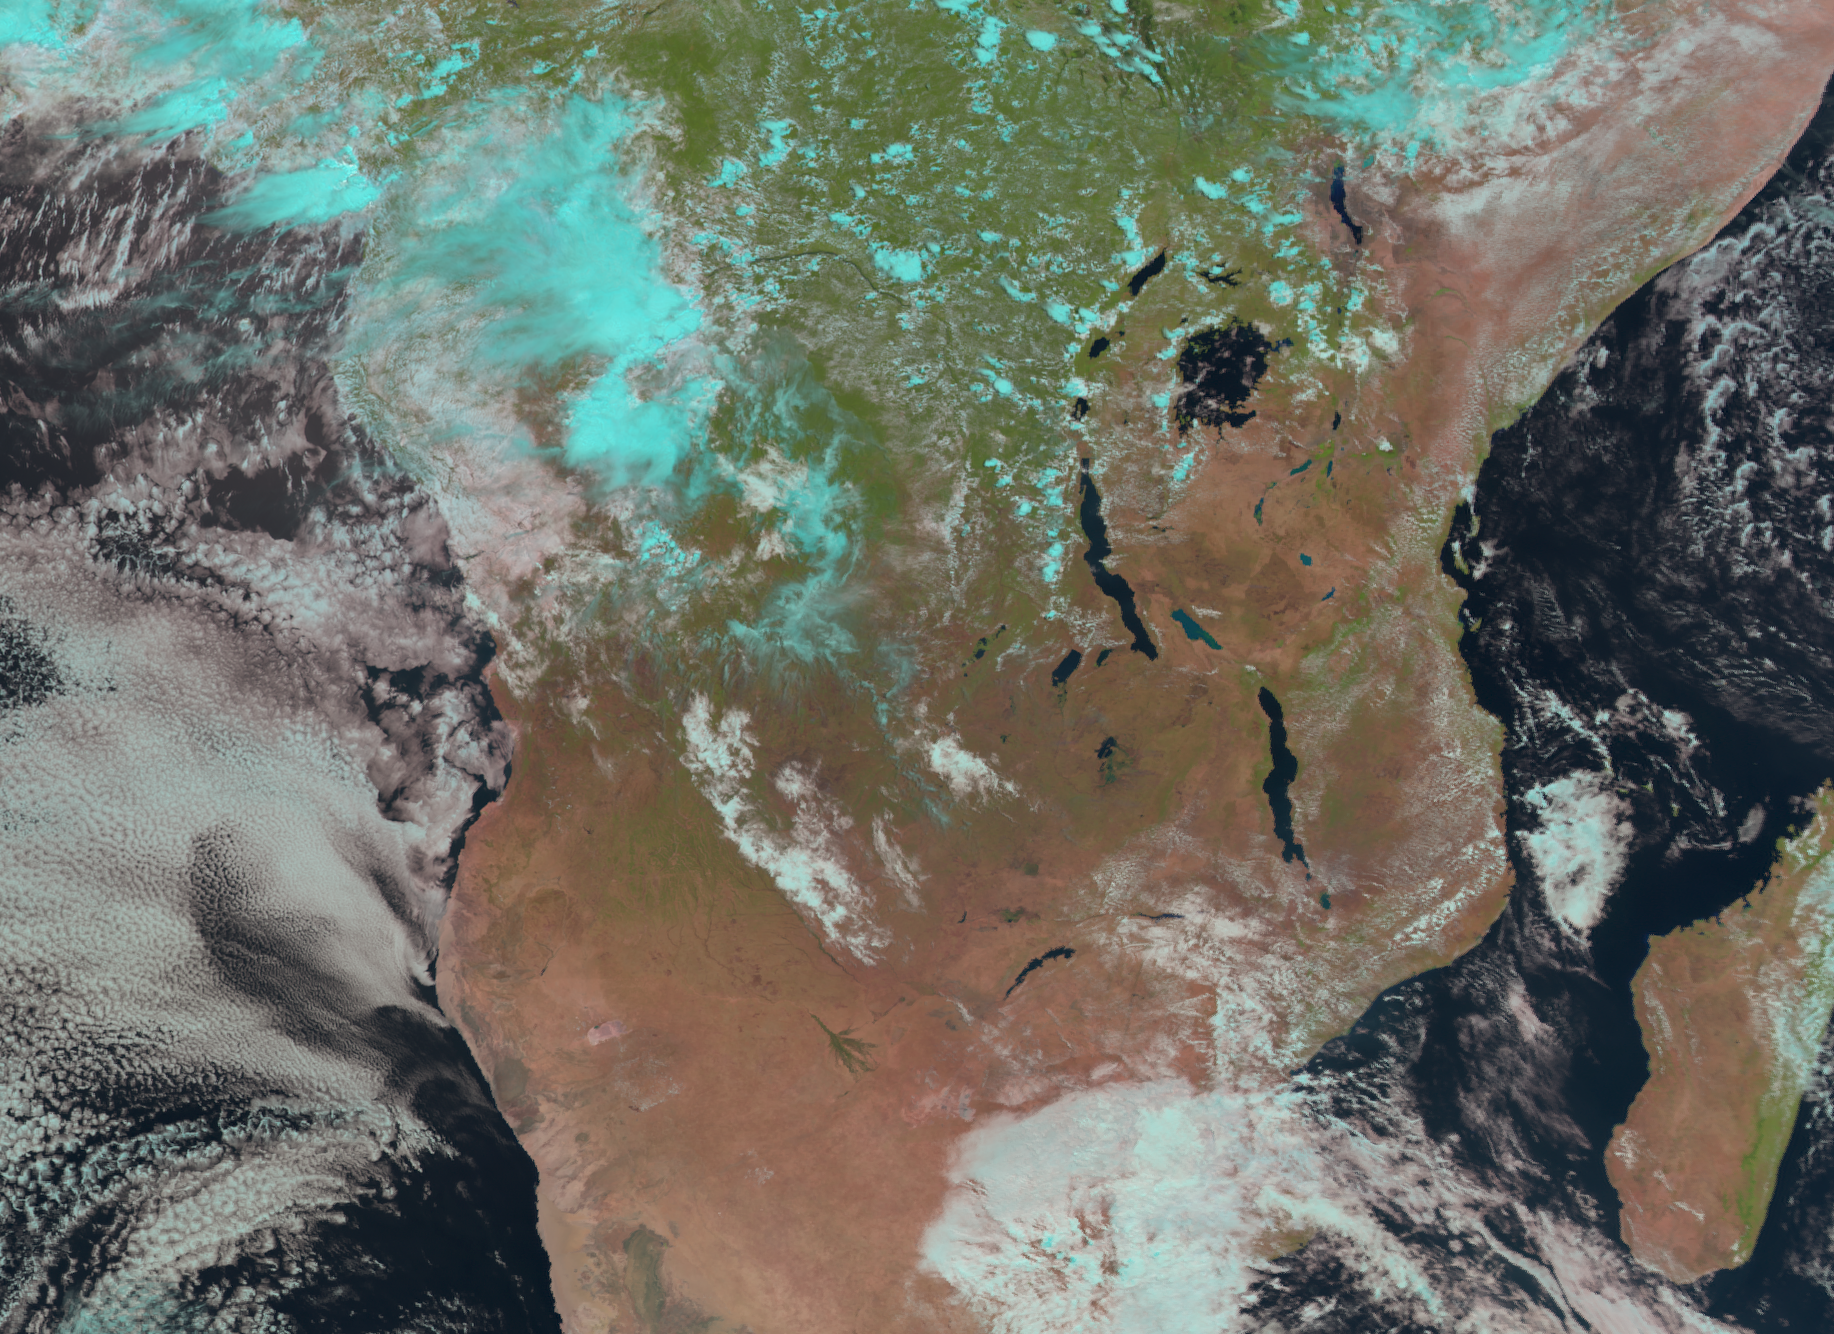
Resample to a different projection#
In the plot above you can see that the raw SEVIRI data has distortion towards edge of the image. By regridding the data we can avoid some of this distortion.
area_id = "Southern Africa"
description = "Southern Africa in Mercator-Projection"
proj_id = "Southern Africa"
proj_dict = {"proj": "eqc"}

width = 1000    # width of the result domain in pixels
height = 1000   # height of the result domain in pixels

llx =  0    # projection x coordinate of lower left corner of lower left pixel
lly =  -30e5  # projection y coordinate of lower left corner of lower left pixel
urx =  55e5   # projection x coordinate of upper right corner of upper right pixel
ury =  10e5   # projection y coordinate of upper right corner of upper right pixel

area_extent = (llx,lly,urx,ury)

resolution=3000
center =(0,0)
area_def = create_area_def(area_id, proj_dict, resolution=resolution, area_extent=area_extent)

seviri_scn = scn.resample(area_def, radius_of_influence=10000)
WARNING:root:shape found from radius and resolution does not contain only integers: (1333.3333333333333, 1833.3333333333333)
Rounding shape to (1334, 1834) and resolution from (3000.0, 3000.0) meters to (2998.909487459106, 2998.5007496251874) meters
Show code cell source
plot_seviri_scn = seviri_scn.show('natural_color')
plot_seviri_scn
Load SEVIRI Fire Database#
Now we’re going to load the SEVIRI fire database from HDF file. This contains the longitude, latitude, and time of where fires have been detected to occur. It also includes an estimate of the Fire Radiative Power (FRP), a measure of the intensity of the fire, for each fire detected.
Show code cell source
# Scale factors for the SEVIRI fire product from:
# https://nextcloud.lsasvcs.ipma.pt/s/CZa8RwDxjGqYezS?dir=undefined&openfile=105793

SCALE_FACTORS = dict(
    FRP=10,
    FRP_UNCERTAINTY=100,
    ERR_FRP_COEFF=10000,
    ERR_BACKGROUND=10000,
    ERR_ATM_TRANS=10000,
    ERR_VERT_COMP=10000,
    ERR_RADIOMETRIC=10000,
    LATITUDE=100,
    LONGITUDE=100,
    FIRE_CONFIDENCE=100,
    BT_MIR=10,
    BT_TIR=10,
    BW_BT_MIR=10,
    BW_BTD=10,
    PIXEL_SIZE=100,
    PIXEL_VZA=100,
    PIXEL_ATM_TRANS=10000,
    RAD_PIX=10000,
    STD_BCK=10000
)

def process_fire_product(fire_pixels):
    # Hack: xarray randomly loads some columns as coordinates, which don't get converted to a dataframe
    # Correct here by removing them as coords and renaming them back to their original name
    coords = list(fire_pixels.coords.keys())
    fire_pixels = fire_pixels.reset_index(coords).reset_coords()
    fire_pixels = fire_pixels.swap_dims({key: f'phony_dim_0' for key in list(fire_pixels.dims.keys())})
    fire_pixels = fire_pixels.rename({f"{name}_": name for name in coords})
    fire_pixels = fire_pixels.to_dataframe()

    for c in fire_pixels.columns:
        if c in SCALE_FACTORS:
            fire_pixels[c] = fire_pixels[c] / SCALE_FACTORS[c]

    fire_pixels['ABS_LINE_1KM'] = fire_pixels.ABS_LINE // 2
    fire_pixels['ABS_PIXEL_1KM'] = fire_pixels.ABS_PIXEL // 2
    fire_pixels.index.name = 'index'
    return fire_pixels

def parse_l2_timestamp(product_name):
    """Parse the timestamp from the SEVIRI L2 product name"""
    timestamp = product_name.split('_')[-1]
    timestamp = pd.to_datetime(timestamp, format='%Y%m%d%H%M')
    return timestamp

# Read in fires, scale and rename dimensions
fires = cat['seviri_fires'].read()
fires = process_fire_product(fires)
fires = fires.rename({'LONGITUDE': 'longitude', 'LATITUDE': 'latitude', 'FRP': 'frp'}, axis=1)

# Grab the timestamp of the product
urlpath = cat['seviri_fires'].describe()['args']['urlpath']
fires['timestamp'] = parse_l2_timestamp(urlpath)

# Convert to geopandas
fires = geopandas.GeoDataFrame(
    fires, geometry=geopandas.points_from_xy(fires.longitude, fires.latitude))

# We're only interested in data from Southern Africa for now
llx =  0    # projection x coordinate of lower left corner of lower left pixel
lly =  -30  # projection y coordinate of lower left corner of lower left pixel
urx =  55   # projection x coordinate of upper right corner of upper right pixel
ury =  10   # projection y coordinate of upper right corner of upper right pixel

fires = fires.cx[llx:urx, lly:ury]
fires = fires.sort_index()
fires
| ABS_LINE | ABS_PIXEL | ACQTIME | BT_MIR | BT_TIR | BW_BTD | BW_BT_MIR | BW_NUMPIX | BW_SIZE | ERR_ATM_TRANS | ... | PIXEL_ATM_TRANS | PIXEL_SIZE | PIXEL_VZA | RAD_BCK | RAD_PIX | STD_BCK | ABS_LINE_1KM | ABS_PIXEL_1KM | timestamp | geometry | |
|---|---|---|---|---|---|---|---|---|---|---|---|---|---|---|---|---|---|---|---|---|---|
| index | |||||||||||||||||||||
| 6 | 1942 | 3065 | 1051 | 321.7 | 313.8 | 48.9 | 313.4 | 10 | 5 | 0.1098 | ... | 0.6517 | 11.97 | 41.26 | 16239 | 0.219 | 0.1575 | 971 | 1532 | 2020-09-01 10:45:00 | POINT (36.19000 -2.40000) |
| 7 | 1953 | 3110 | 1051 | 316.8 | 306.2 | 39.9 | 309.0 | 10 | 5 | 0.1071 | ... | 0.6518 | 12.35 | 43.23 | 13830 | 0.184 | 0.1477 | 976 | 1555 | 2020-09-01 10:45:00 | POINT (37.93000 -2.72000) |
| 8 | 1955 | 3110 | 1051 | 321.8 | 311.5 | 46.6 | 312.6 | 13 | 5 | 0.1078 | ... | 0.6509 | 12.35 | 43.23 | 15938 | 0.219 | 0.2502 | 977 | 1555 | 2020-09-01 10:45:00 | POINT (37.93000 -2.78000) |
| 9 | 1955 | 3111 | 1051 | 323.5 | 305.7 | 38.4 | 311.9 | 14 | 5 | 0.1083 | ... | 0.6502 | 12.36 | 43.28 | 15542 | 0.233 | 0.2599 | 977 | 1555 | 2020-09-01 10:45:00 | POINT (37.97000 -2.78000) |
| 10 | 2009 | 3069 | 1051 | 316.0 | 311.5 | 19.2 | 311.8 | 16 | 5 | 0.1020 | ... | 0.6612 | 12.05 | 41.68 | 15268 | 0.179 | 0.0447 | 1004 | 1534 | 2020-09-01 10:45:00 | POINT (36.44000 -4.30000) |
| ... | ... | ... | ... | ... | ... | ... | ... | ... | ... | ... | ... | ... | ... | ... | ... | ... | ... | ... | ... | ... | ... |
| 904 | 2566 | 3166 | 1049 | 318.7 | 312.2 | 12.4 | 313.6 | 16 | 5 | 0.1476 | ... | 0.5852 | 15.49 | 54.49 | 16312 | 0.196 | 0.0326 | 1283 | 1583 | 2020-09-01 10:45:00 | POINT (44.54000 -20.99000) |
| 905 | 2597 | 2398 | 1049 | 315.7 | 310.0 | 21.6 | 312.2 | 16 | 5 | 0.0843 | ... | 0.7036 | 10.35 | 29.65 | 15512 | 0.176 | 0.0800 | 1298 | 1199 | 2020-09-01 10:45:00 | POINT (16.11000 -20.95000) |
| 906 | 2597 | 2399 | 1049 | 319.1 | 310.3 | 16.4 | 311.9 | 16 | 5 | 0.0844 | ... | 0.7032 | 10.35 | 29.68 | 15337 | 0.199 | 0.0679 | 1298 | 1199 | 2020-09-01 10:45:00 | POINT (16.14000 -20.95000) |
| 907 | 2598 | 2398 | 1049 | 320.8 | 310.4 | 18.2 | 311.6 | 16 | 5 | 0.0842 | ... | 0.7037 | 10.36 | 29.69 | 15187 | 0.211 | 0.0534 | 1299 | 1199 | 2020-09-01 10:45:00 | POINT (16.12000 -20.98000) |
| 908 | 2598 | 2399 | 1049 | 325.8 | 310.3 | 12.6 | 311.4 | 16 | 5 | 0.0843 | ... | 0.7035 | 10.36 | 29.71 | 15018 | 0.252 | 0.0381 | 1299 | 1199 | 2020-09-01 10:45:00 | POINT (16.14000 -20.98000) |
880 rows × 29 columns
Geographical distribution of Fires#
Here we plot the geographical distribution of fires detected by SEVIRI over Southern Africa.
Show code cell source
fires.hvplot.points('longitude', 'latitude', c='frp', geo=True, alpha=0.2,
                    tiles='ESRI', xlim=(llx, urx), ylim=(lly, ury), cmap='autumn', logz=True,
                    dynamic=False)
Visualising Fire Pixels with Satellite Imagery#
Visualise a color image of the SEVIRI region using hvplot.
Show code cell source
seviri_dataset = seviri_scn.to_xarray_dataset()

img = get_enhanced_image(seviri_scn['natural_color'].squeeze())
img = img.data
img = img.clip(0, 1)
img = (img * 255).astype(np.uint8)

seviri_dataset['natural_color'] = img

grid = seviri_scn.min_area().get_lonlats()
lons, lats = grid[0][0], grid[1][:, 0]
seviri_dataset = seviri_dataset.assign_coords(dict(x=lons, y=lats))
seviri_dataset = seviri_dataset.rename(dict(x='longitude', y='latitude'))

plot_SEVIRI_rgb = seviri_dataset['natural_color'].hvplot.rgb(x='longitude', y='latitude', bands='bands', rasterize=True, data_aspect=1)
plot_SEVIRI_rgb
Now overlay the fire pixels ontop of the SEVIRI image, along with the FRP for each fire pixel. Try zooming in with rasterize=False, you should be able to see clear smoke trails at the locations of some of the fires!
Show code cell source
rgb = seviri_dataset['natural_color'].hvplot.rgb(x='longitude', y='latitude', bands='bands', data_aspect=1, hover=False, title='True Colour', rasterize=True)
points = fires.hvplot.points('longitude', 'latitude', c='frp', cmap='autumn', logz=True, alpha=0.4)
plot_fires_SEVIRI_rgb = rgb*points
plot_fires_SEVIRI_rgb
We can also overlay the fire pixels ontop of the band difference between SEVIRI 3.9 and 10.8 micron wavelength bands. The 3.9 and 10.8 bands are thermal bands. Fires will appear as very bright pixels in the difference between these two bands. Try zooming in with rasterize=False, you should be able to clearly see bright spots at the location of each fire pixel.
Show code cell source
band_difference = seviri_dataset['IR_039'] - seviri_dataset['IR_108']
thermal = band_difference.hvplot.image(x='longitude', y='latitude', cmap='viridis', data_aspect=1, hover=False, title='Band 20: 3.7 micron', rasterize=True)
points = fires.hvplot.points('longitude', 'latitude', c='frp', cmap='autumn', logz=True, alpha=0.4)
plot_fires_SEVIRI_thermal = thermal*points
plot_fires_SEVIRI_thermal
Summary#
This notebook has demonstrated the use of:
The
satpypackage to easily load, plot and regrid satellite data from the SEVIRI sensor.hvplotto interatively visualise wildfire pixels detected from the SEVIRI sensor.geopandasto load, filter, and manipulate historical wildfire pixel data.intakethe load data, including using a custom plugin for obsecure file formats.
Citing this Notebook#
Please see CITATION.cff for the full citation information. The citation file can be exported to APA or BibTex formats (learn more here).
Additional information#
License: The code in this notebook is licensed under the MIT License. The Environmental Data Science book is licensed under the Creative Commons by Attribution 4.0 license. See further details here.
Contact: If you have any suggestion or report an issue with this notebook, feel free to create an issue or send a direct message to environmental.ds.book@gmail.com.
Notebook repository version: v1.0.5
Last tested: 2024-03-11